This is a simple little GUI I created in order to aid with the intuition of understanding the coupling prior framework. I have made my code available on my bitbucked repository. You may download the repository and run this GUI if you have MATLAB installed on your computer. Alternatively, you can simply view the source code here and copy and paste it into a blank script file and run it that way.
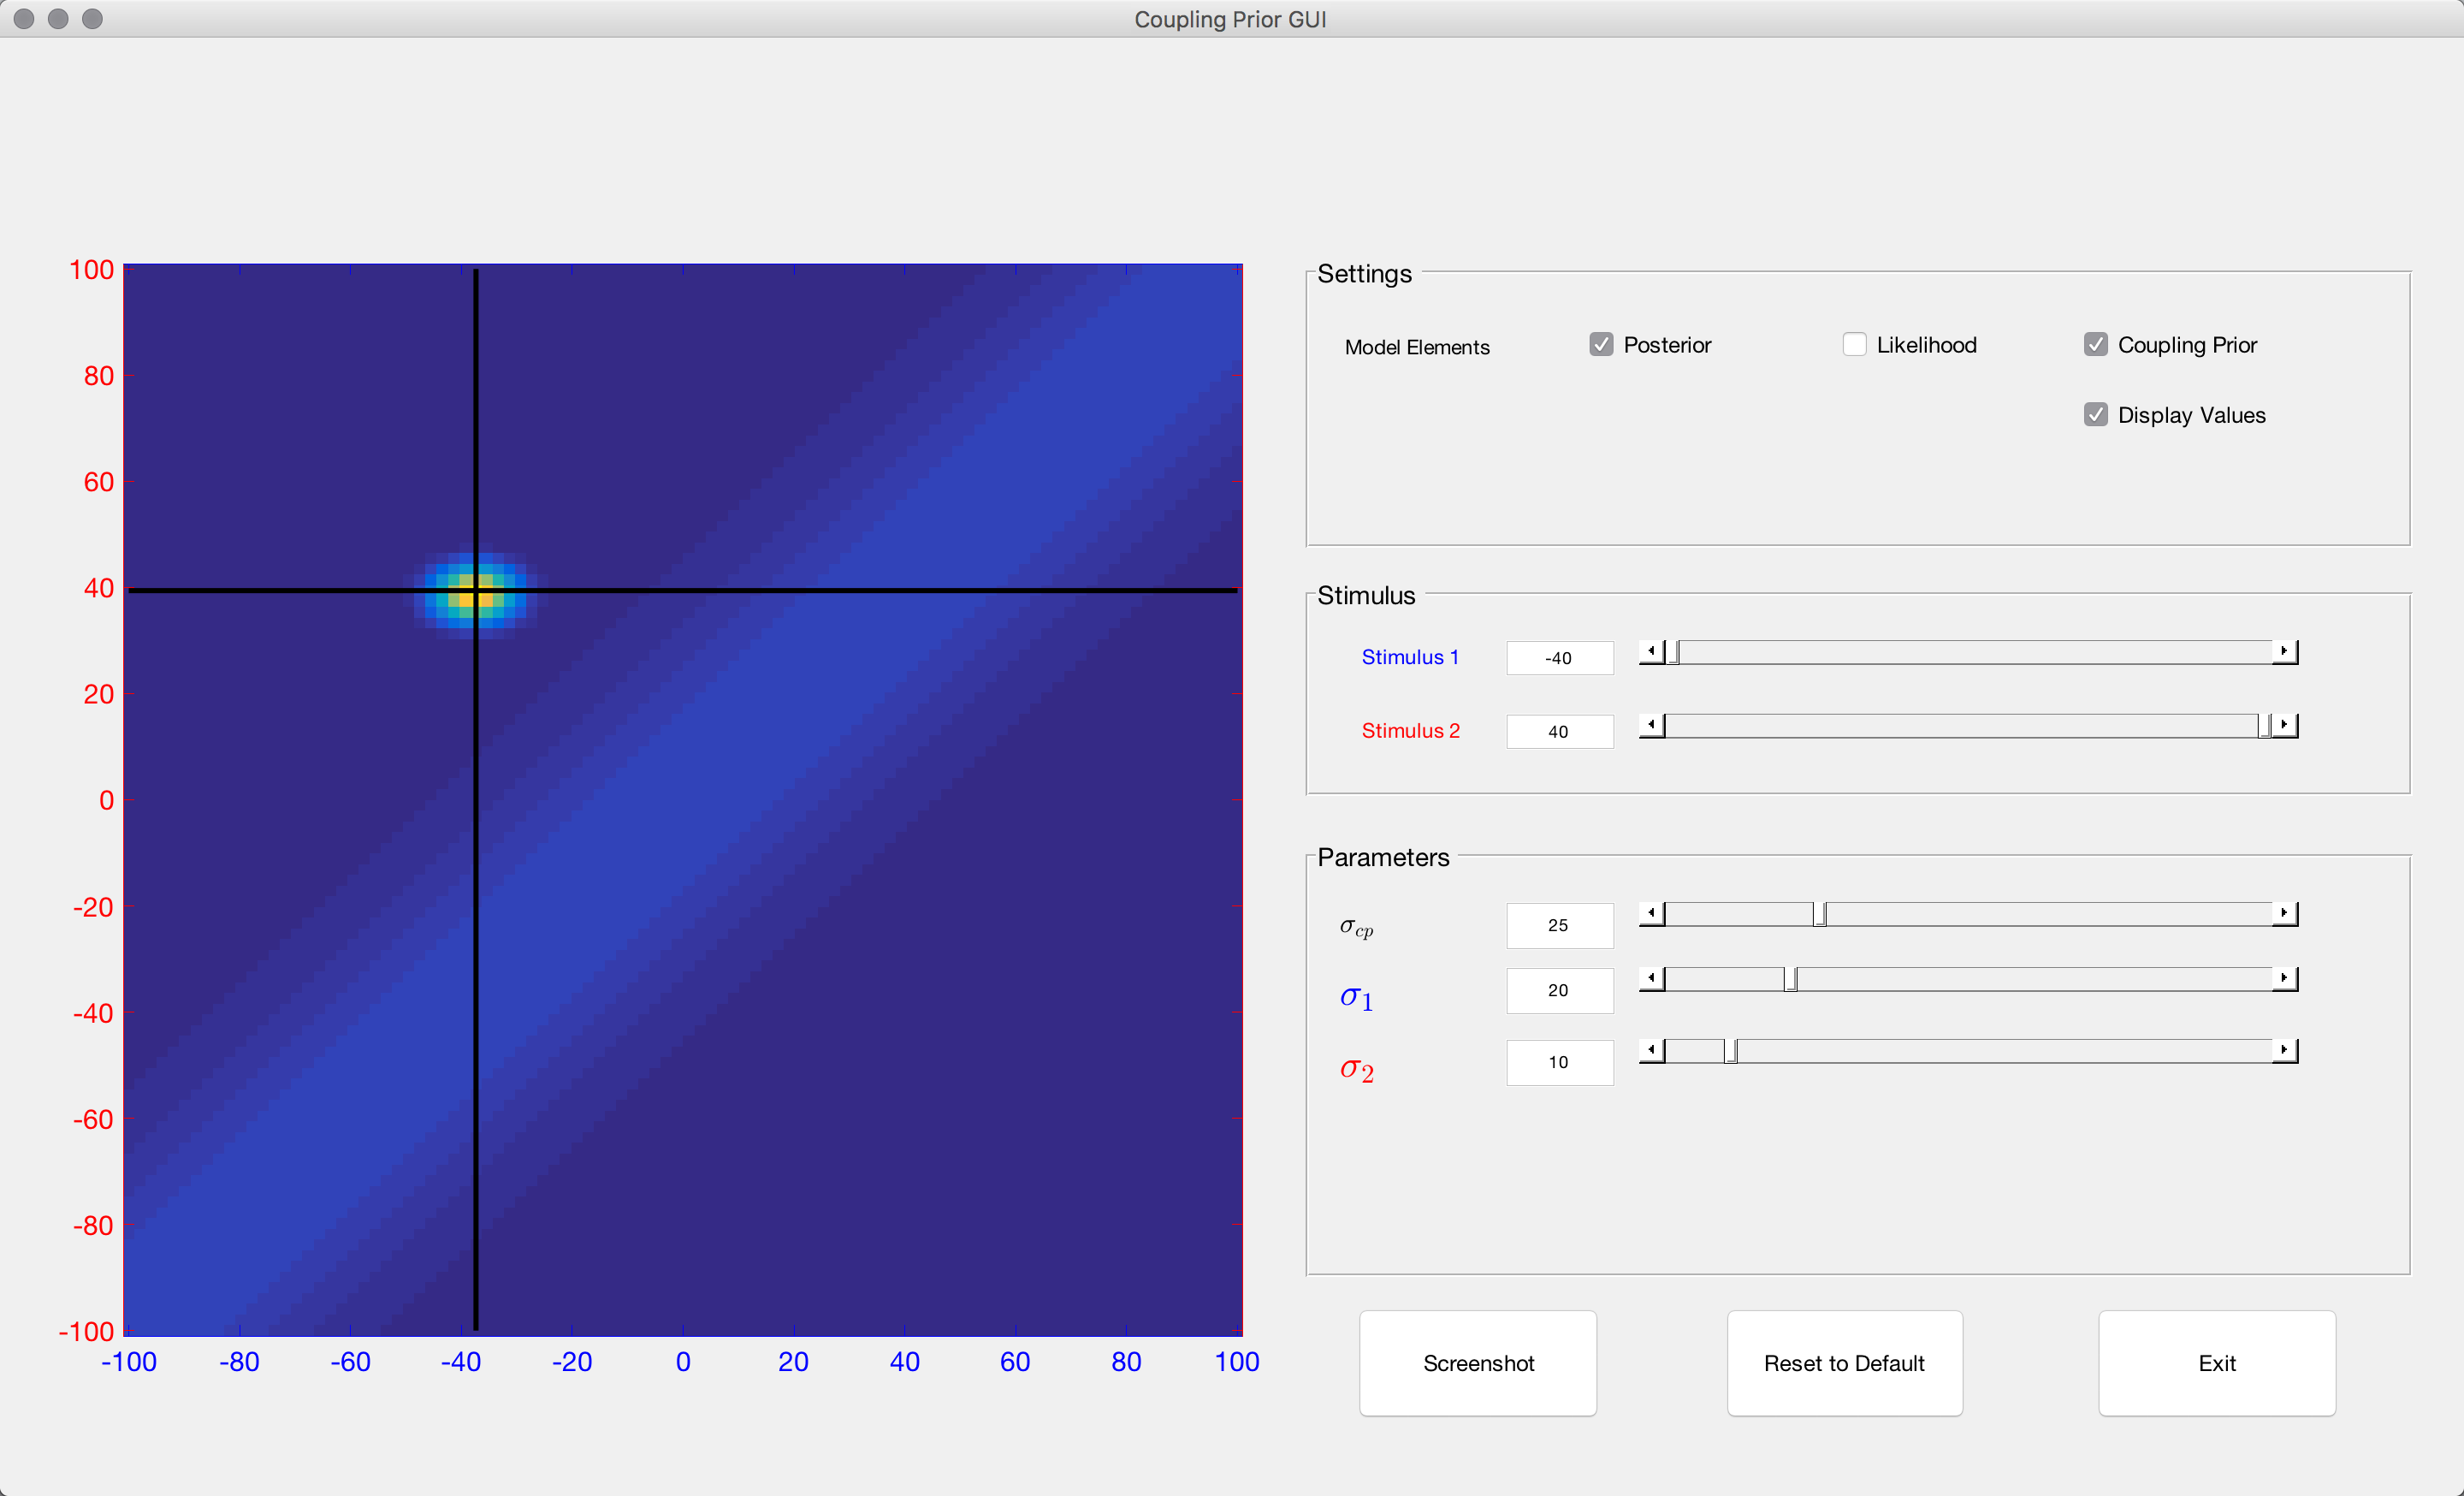
Here are some screenshots from my testing and playing with it.

As you can see, this is plotting a pair of stimuli as a 2-d joint probability distribution, with Stimulus 1 distributed along the x-axis and Stimulus 2 along the y-axis. The three sigma terms represent the strength of the coupling, and the noise in the two stimuli representations, respectively.
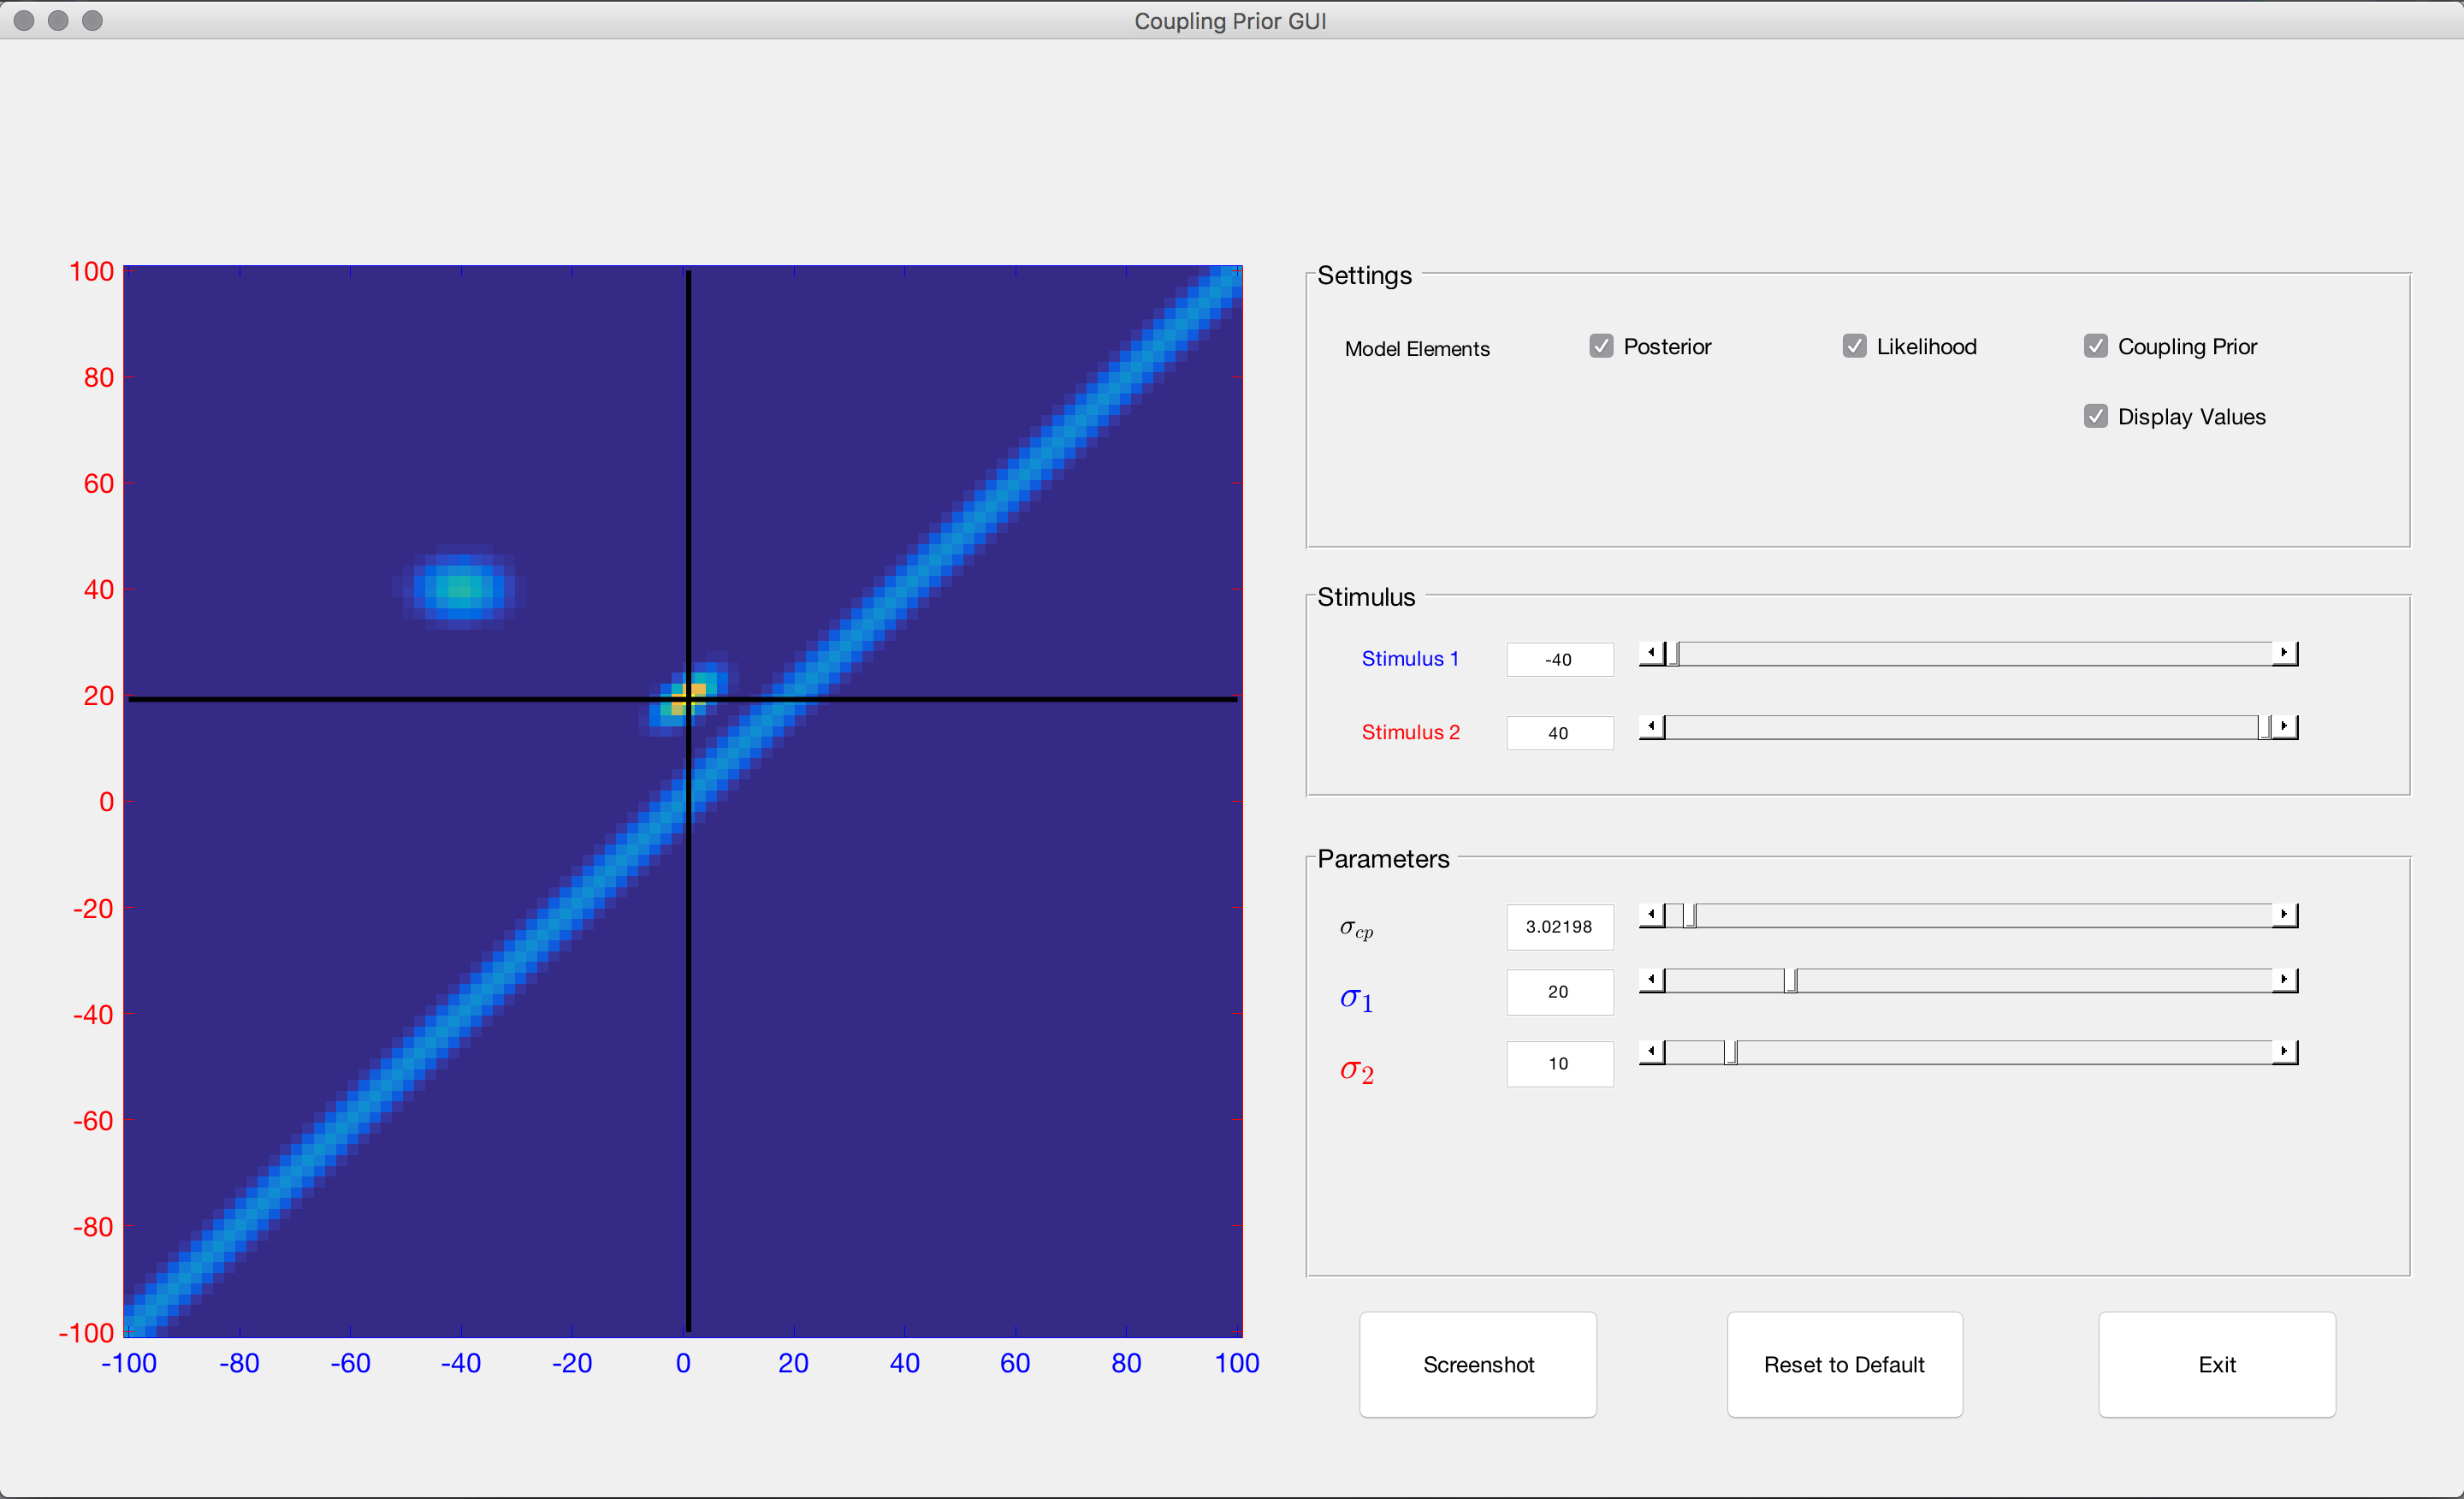
Here is another screenshot demonstrating the effect of a much stronger coupling and also having both likelihood and posterior selected in addition to the prior. The posterior is identifiable in that it is located where the two black lines intersect, showing its most probably value in its distribution, and thus the most probable estimate of the joint location.

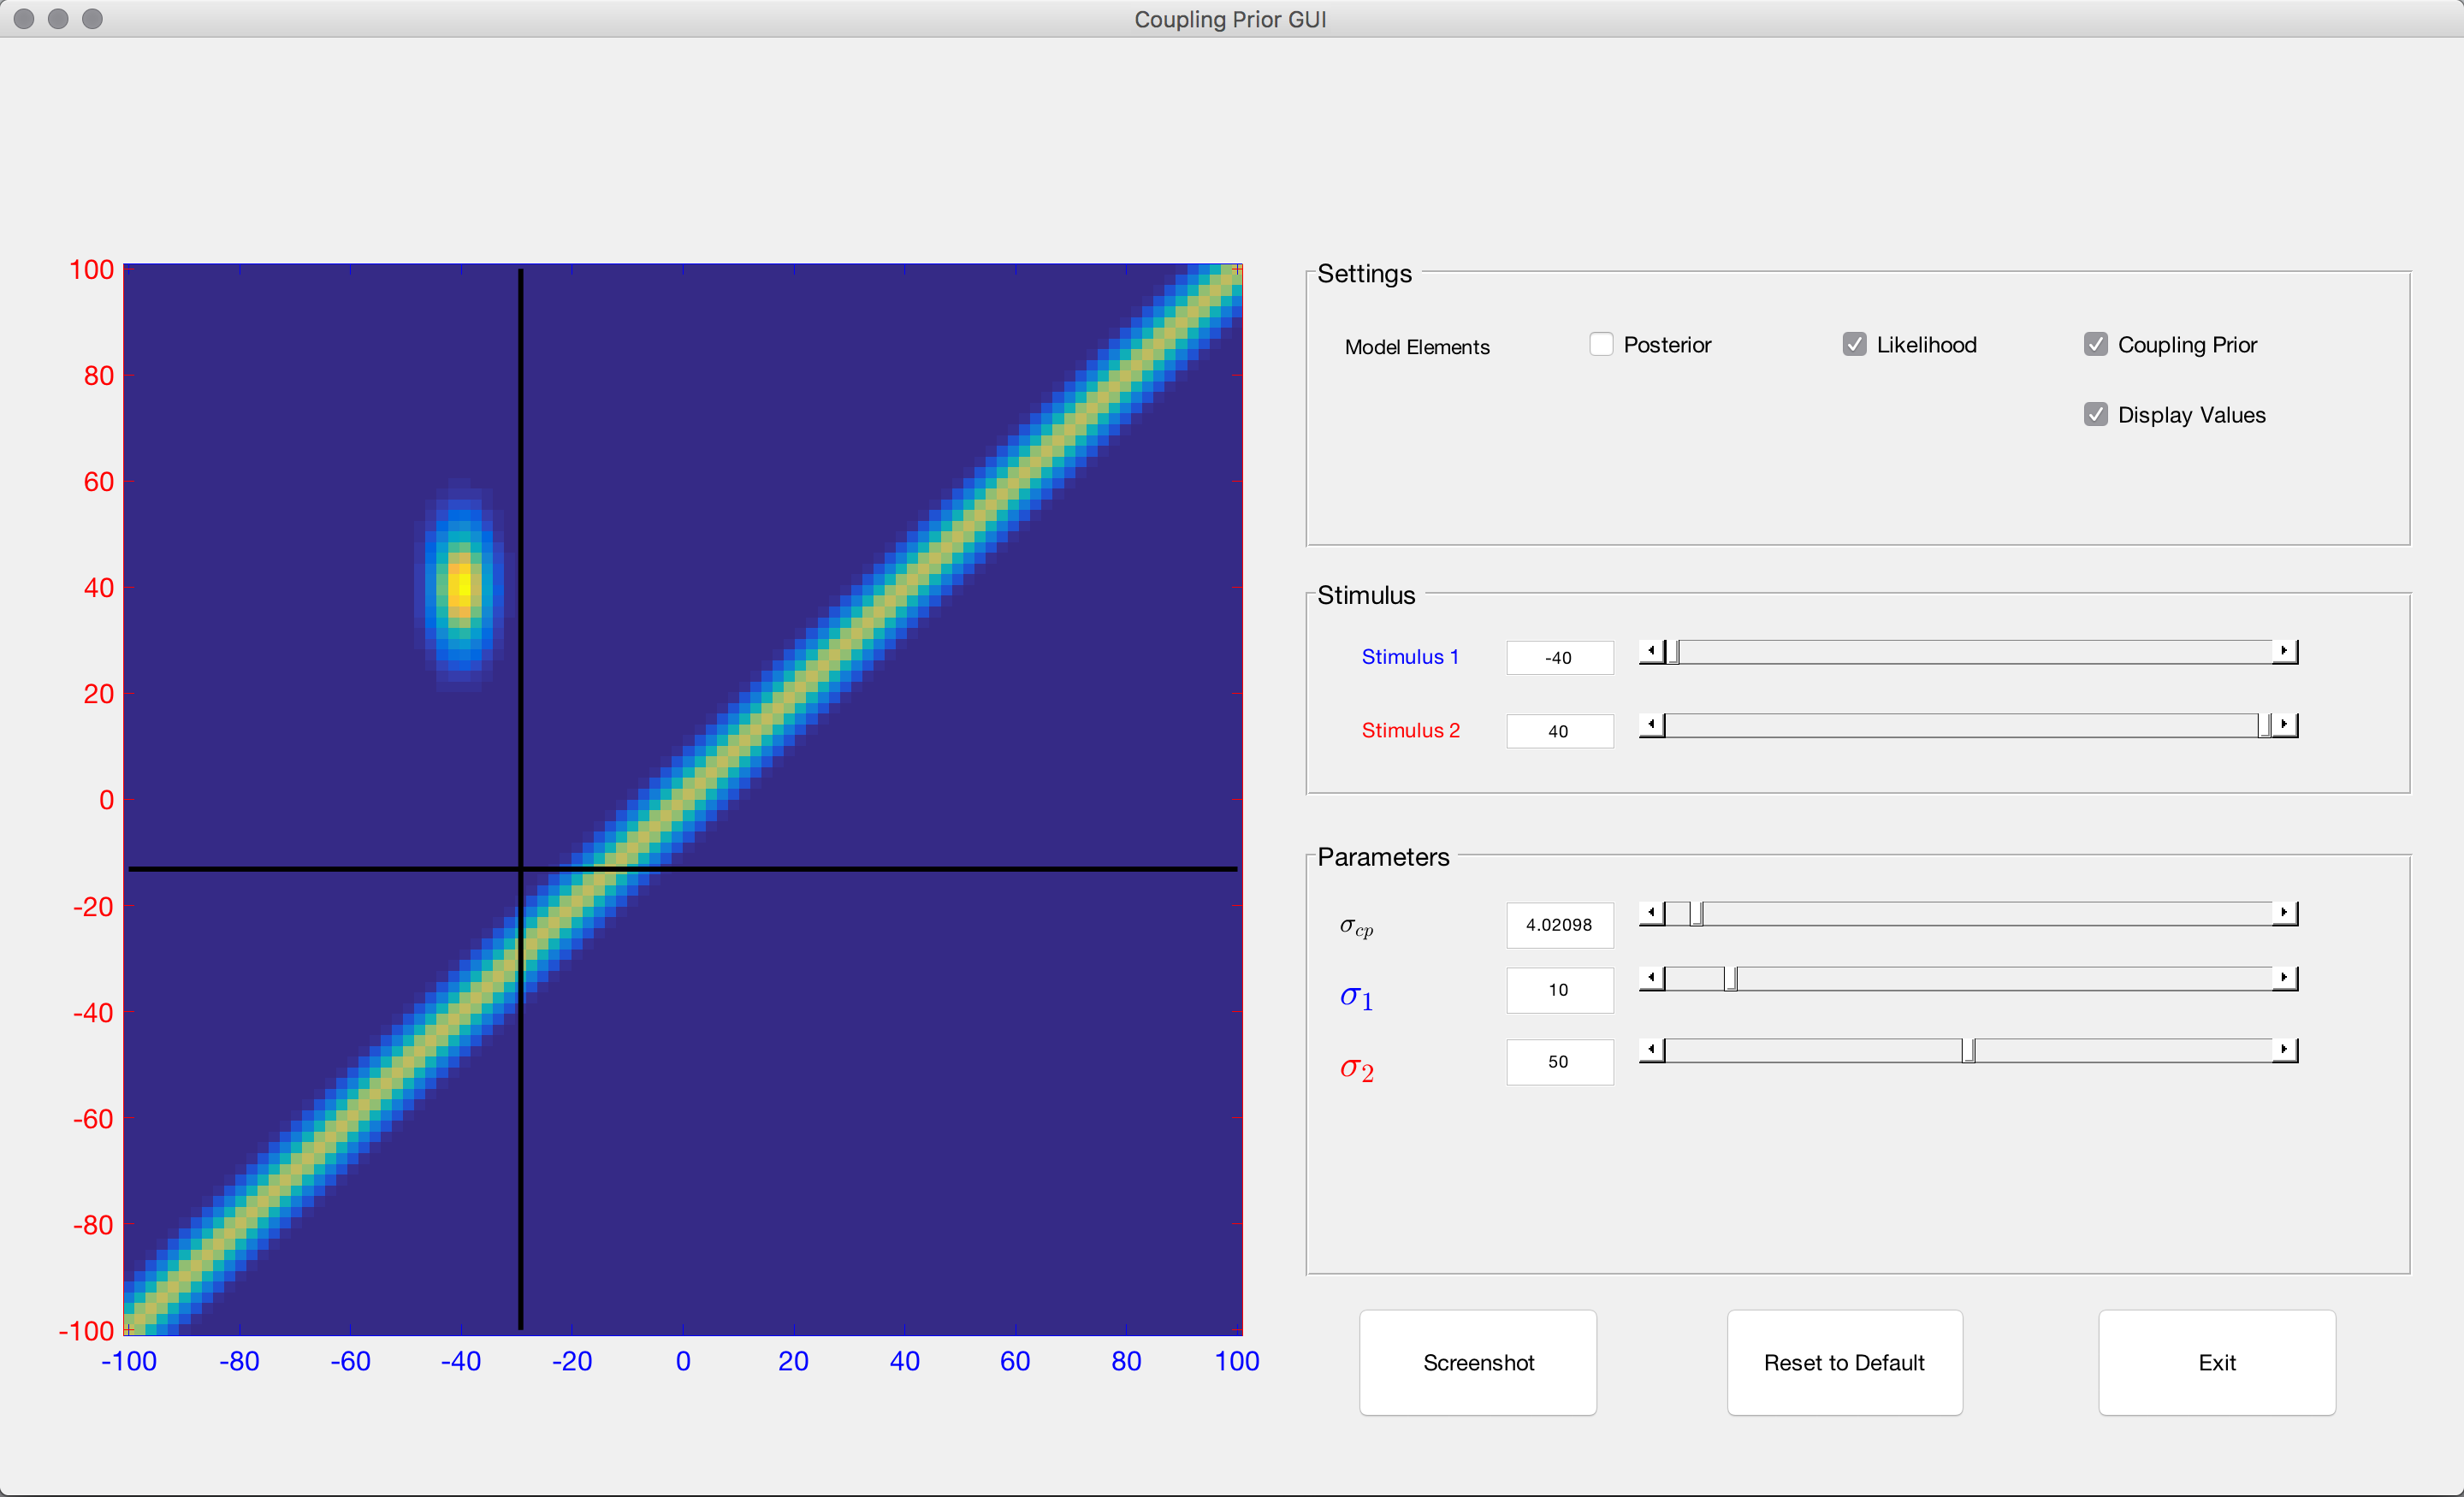
Finally, I wanted to show just one more screenshot showing a functionality of the GUI where the posterior is not shown, whereas only the crosshairs which show its most probable value are. Here I have modeled a situation where the ratio of reliabilities of the two signals is far from 1, and thus that the estimate of the joint stimulus value is biased much more so for stimulus 2 than for stimulus 1.
Of course, the ultimate value of a tool like this is to build intuition and therefore it’s best use case is to be played with and investigated in an interactive fashion. I hope that you will therefore find this tool to be a useful one! If you do use this, please simply acknowledge me in any redistributed form and (if possible) give me a link.
